DC Motor Simulator & Load Test Virtual Lab
Free online electric motor simulation and DC machines virtual lab — run a brake test, Swinburne's test, speed control and retardation test on a brake-drum rig, diagnose a faulty machine from its own readings, then export a printable test report. Simulate • Explore • Practice • Quiz

Display Controls
Σ Live equations — values substituted from current state
⚡ Power flow — input → output, with copper loss
💡 What-if coach — insights from current values
1 Overview
The DC Motor Simulator lets you explore the operating characteristics of direct-current motors — back EMF, speed-torque curves, armature current, the full loss ledger and efficiency. Four motor configurations are modelled: shunt (field in parallel with armature), series (field in series), separately excited (independent field supply), and compound (both windings, cumulative or differential). Each reacts differently to changes in supply voltage, field flux, armature resistance, and mechanical load.
Every preset carries the constants of a real nameplate — Ke, shunt-field resistance, brush drop, and the friction, windage and core-loss coefficients — so the numbers on screen are the numbers that machine would actually produce. Slider ranges follow the loaded machine: a 12 V hobby motor and a 600 V traction motor do not share one load-torque scale.
This tool is built for electrical-engineering students, instructors, and industrial technicians who want a fast hands-on intuition for motor characteristics without physical lab equipment.
2 Building the Circuit

The simulator opens in Simulate mode on the 5 kW lathe machine: shunt-wound, V = 220 V, Ra = 0.30 Ω, φ = 20 mWb per pole, load torque = 32 N·m — which runs at its rated 1500 rev/min and about 85 % efficiency. To begin:
- Pick a Motor Type: Shunt, Series, or Separately Excited.
- Click a preset chip (12 V Hobby, 220 V Lathe, 440 V Mill, Crane Hoist, EV Traction, Auto Starter, Ward-Leonard, Field Weakening, Compound Press) to load a complete machine — nameplate constants included — in one click. Each preset sits on its rated speed when first loaded.
- Field flux is entered in milliwebers per pole, the range real machines actually occupy (roughly 1–60 mWb). In series mode the same control becomes kf in mWb per amp, because a series field has no fixed flux.
- Drag the sliders or type into the stepper boxes for precise values. The text input is unit-aware — in Imperial mode you can enter values in lbf·ft and they convert back to SI internally.
- Watch the readout cards, the operating-point marker on the speed-torque curve, and the rotating rotor animation update in real time.
3 Energising the Circuit
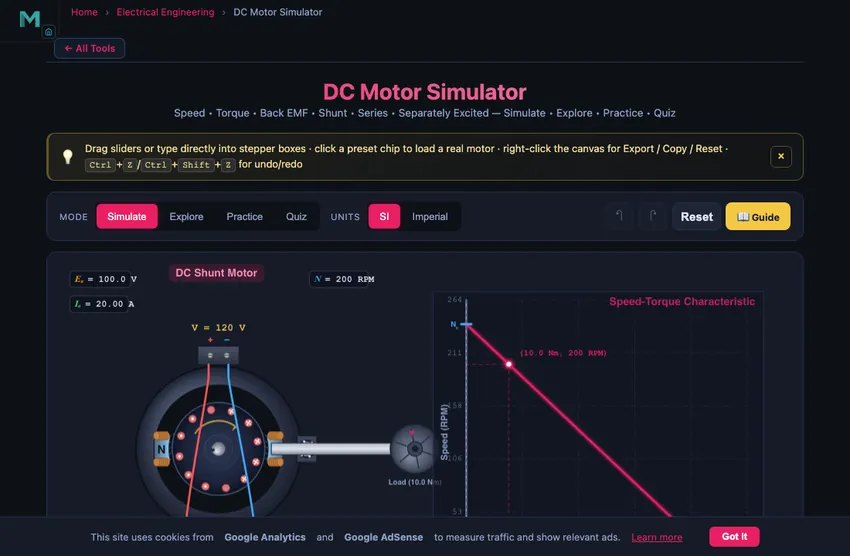
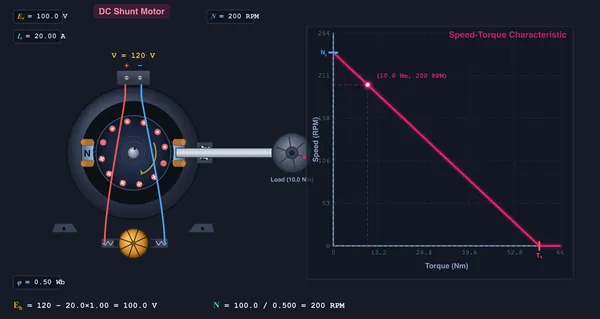
Simulate is the main interactive workspace. The canvas shows a motor test rig on top — the machine, its shaft, a belt drive and a brake-drum dynamometer, all on a bedplate — with the speed-torque characteristic below it. Use the canvas feature toggles to focus the view:
The machine itself is drawn as an end view, because that is the view that explains the torque: the field poles alternate N–S around the yoke (2 or 4 of them, depending on which machine the preset loads), flux crosses the air gap radially into the armature, and each conductor carries current out of the page (•) or into it (×) according to which pole it is passing. The commutator sits concentric with the shaft with its brushes on the neutral axis, which is why the supply leads run down the outside of the frame instead of across the rotor. Because the gap field is radial, every conductor force comes out tangential and in the same direction — that is exactly the job the commutator does.
Mind which torque you are reading. The belt is a 2:1 step-up: the motor pulley is 80 mm and the brake drum 160 mm, so the drum turns at half the shaft speed and carries twice the torque. Power is the same at both ends (an ideal belt), but the two torques are not. The classic brake-test formula T = (W − S) × R gives the torque at the drum; the motor's own shaft torque is F × r, half as much. Every torque this tool reports — readouts, curves, tables and the PDF — is the shaft torque, and the canvas prints both so the factor of two is never a surprise. That trade is the whole point of a belt drive, and worth seeing on a rig.
The belt drive is live: the belt runs at the shaft's surface speed, and its ribs and direction arrows ride the same path so they can never disagree with it. The brake drum carries a band running to two spring balances, which read the belt tensions in newtons — T1 on the tight side and T2 on the slack side. Because (T1 − T2) × Rdrum is the drum torque, the two readings always differ by the net belt pull F = Tshaft / rpulley.
The two tensions move together, not independently. A belt is installed at some initial tension T0 and, being effectively inextensible, keeps T1 + T2 = 2T0 as it transmits — the tight side gains exactly what the slack side loses, which is why T1 − T2 equals the net pull. Friction sets the limit: the drive can only hold while T1/T2 ≤ eμθ (the capstan relation, about 2.4 for this wrap), and past that the belt slips and the rig says so. This rig's belt is tensioned for a 1.6× service factor, so it holds through normal overload and slips only well past the nameplate.
Drag the Load Torque slider and four things move at once: T1 climbs while T2 falls away, that balance's spring visibly stretches, the belt darkens and its slack side sags further, and the drum rim glows with the power the brake is absorbing. The slider itself uses square-law travel — half travel is a quarter of full load — so you get fine control around rated load and can still wind the machine all the way to standstill. Its range follows the machine: change the voltage, resistance or field and the end-stop moves with the new stall torque.
- Show Schematic — toggles the whole test rig on/off.
- Show Speed-Torque Curve — toggles the lower graph.
- Show Equation — on-canvas classical equations Eb = V − IaRa − Vbrush and N = Eb/(Keφ), with both machine constants shown side by side.
- Show Grid — background grid for sketch precision.
Right-click the canvas for Copy operating point, Export PNG, Export sweep CSV, Toggle grid, and Reset all.
If you load the shaft past the machine's stall torque, the canvas shows a STALLED banner and the readouts drop to zero speed with the armature drawing its full short-circuit current. That state is real and destructive — a stalled DC motor has no back EMF to limit the current.
4 Motor Types — What Changes
- Shunt: field in parallel with armature; flux nearly constant. Speed-torque curve is almost flat. Best for constant-speed loads like lathes, blowers, and conveyors.
- Series: field in series with armature; flux rises with load current. Torque is proportional to Ia2, giving huge starting torque. Speed drops steeply with load — never run a series motor at no load (runaway).
- Separately Excited: the field supply (Vfield) is independent of the armature supply. A second slider appears so you can change V or φ separately. Ideal for precise speed control (Ward-Leonard, modern thyristor drives).
- Compound: both a shunt and a series winding on the same poles. Cumulative (+) adds the series flux — high starting torque with usable regulation, as in presses and rolling mills. Differential (−) subtracts it: flux falls as load rises, so speed can climb with load. That positive feedback is unstable, which is why differential compounding is almost never built.
5 Learning Panels, Calculations & Math
Below the readouts you'll find three collapsible Learning panels:
- Live equations — classical LaTeX rendering (Eb, N, T, η) with current values substituted in, and both machine constants shown explicitly.
- Power flow — the full ledger Pin = Pout + Pcu + Pseries + Pbrush + Pfield + Prot, itemised in watts and as a percentage of input, plus the EbIa = Tω cross-check.
- What-if coach — plain-English diagnostic notes that change as you tweak the inputs (over-fluxed, near stall, runaway risk, etc.).
Click Show Calculations (the calculator FAB at the bottom-right of the canvas) for a step-by-step derivation of the current operating point in classical mathematical notation.
6 Explore, Practice & Quiz
Explore mode has four categories — Basics, Motor Types, Speed Control, Losses & Efficiency — each with diagrams and worked examples.
Practice mode generates 14 problem types: back EMF, armature current, torque, speed from Eb, output power, efficiency, shunt-field current, starting current, no-load speed, stall torque, speed regulation, copper loss, converting Ke to Kt, and back EMF including brush drop. Values are drawn so the answer is always physically possible — back EMF can never come out negative — and the accepted tolerance scales with the size of the answer.
Quiz mode serves 8 randomised questions (MCQ + numeric) covering every key concept, with detailed answer review afterwards. Multiple-choice options are reshuffled on every question, so position carries no information.
7 Units, Export & Keyboard Shortcuts
- SI / Imperial toggle (top toolbar, or press U): switches torque (N·m ↔ lbf·ft), power (W ↔ hp), force (N ↔ lbf — the belt tensions and spring balances), length (mm ↔ in — the pulley and drum radii), belt speed (m/s ↔ ft/s), the torque constant Ktφ, the machine's nameplate rating and the rotor inertia (kg·m² ↔ lb·ft²). It reaches everywhere: readout cards, stepper units, the rig annotations drawn on the canvas, every graph axis and caption, the live-equation and power-flow panels, Show Calculations, Copy operating point, and the PDF test report. Voltage, current, resistance, speed, flux and Keφ (volts per rev/min) have no imperial form and stay as they are. All internal maths is always SI — only the display converts.
- CSV export is deliberately always SI, with the unit named in every column header (
Tload_Nm,Pin_W). Raw data should carry one canonical unit system whichever way the toggle happens to be set when you export it. - Export CSV — downloads a 60-point speed-torque sweep at the current settings with the complete loss breakdown per row (copper, series, brush, field, rotational, efficiency, stall flag), ready for Excel/Python plotting.
- Export PNG — saves the full canvas (DPR-aware) as a watermarked study sheet.
- Keyboard: Space play/pause, Ctrl+Z undo, Ctrl+Shift+Z redo, R reset, U toggle units.
8 Tips & Best Practices
- Start with the shunt motor and a small load. Notice that Eb ≈ V — the armature drop is tiny when Ia is small.
- Load the Crane Hoist preset and drag load torque toward zero. Speed climbs from 700 to roughly 2600 rev/min and then stops rising — windage is the only thing left holding it back. That is the series-motor runaway condition, bounded here by real rotational losses rather than an arbitrary cut-off.
- Try field weakening: load Ward-Leonard, then drag Vfield from 220 V down to 110 V. Flux halves and speed roughly doubles, while armature current rises to hold the same torque — constant power, not constant torque.
- Compare the operating point for the same load on shunt vs. series — the same shaft torque gives very different speeds.
- Open Show Calculations and look at step 1. Speed uses Ke = PZ/60A; torque uses Kt = PZ/2πA. They differ by a factor of 9.5493, and step 7 shows why: it is exactly what makes EbIa = Tω come out true.
- Use the What-if coach panel to learn the operating regimes (light load, moderate load, near stall) without memorising the curve.
- Load the machine and watch the rig, not just the numbers: the belt darkens, W rises on the spring balance, and the operating point walks down the curve — three views of the same change.
9 Load Test Lab — Running a Standard Experiment
Press ⚗ Load Test in the control bar to open the procedure picker. Four standard DC-machine experiments are bundled, each a defined sequence of steps that the rig performs on its own while you watch:
| Procedure | Reference | What it does | What you get |
|---|---|---|---|
| Brake Test (direct loading) | IS 4889 · IEEE 113 | Tightens the brake in five steps from no load to 125% of rating, reading both spring balances at each point | Torque, output power, measured efficiency, speed regulation, performance curves |
| Swinburne's Test | BS EN 60034-2-1 | Runs the machine light, separates the constant losses from the no-load input, predetermines efficiency without ever loading it | Wc, predetermined η at 25–125%, and the error against a real brake test |
| Speed Control Test | IEEE 113 | Armature-voltage control from 40 to 100% of rated volts, then field weakening from full flux to 45% | N vs V, N vs φ, base speed, overall speed range |
| Retardation Test | IS 4889 | Opens the supply at no-load speed and logs the coast-down as the rotor runs against its own losses | dN/dt, J, rotational loss, speed-decay curve |
What conditions does a test run at? Not the ones on your sliders. Every procedure opens by restoring the loaded machine to its nameplate operating point, and every set-point after that is a percentage of the machine's rated values — 25 to 125% of rated torque, 40 to 100% of rated volts, 100 down to 45% of rated flux. That is what makes a run repeatable and lets two machines be compared on the same footing. What it never does is change which machine is on the bench: the preset you loaded and the motor type you chose both survive the reset, and your own settings are restored the moment the run ends or you cancel it. If you want a test at your operating point rather than at the nameplate, run the machine manually and read the live readouts — they come from the same model.
A detail worth noticing in the Speed Control Test: its first step re-connects the field to a separate supply. That is not a simulator quirk — armature-voltage control only means anything if the flux is held constant, and on a plain shunt machine the field sits across the very supply you are varying, so flux falls with voltage and the speed barely moves (measured here: 1395 rpm at 40% volts against a 1531 rpm base). A real DC machines lab re-wires the field for exactly this reason before running the experiment.
While a test runs, a banner across the rig names the procedure, counts the steps, shows the time remaining and narrates the step in progress — "Tightening the brake to 75% of rated load", "Waiting for speed and current to settle". The controls lock so the run cannot be disturbed, and ✕ CANCEL on the banner abandons it and hands your settings back untouched.
When the run finishes, the graph tabs beneath the canvas unlock the views that test produced, and 📑 Report appears in the control bar. It opens a print-ready A4 test report — machine specification, test conditions, the full observation table, computed results, a verdict paragraph and the plotted characteristic — then opens your print dialog, where Save as PDF gives you the file for a lab record.
Swinburne's test is offered only on shunt, separately excited and compound machines. A series motor has no genuine no-load condition — its flux collapses as the current falls, so it races instead of settling — and the picker says so rather than quietly producing a meaningless number. That restriction is a property of the method, not of this simulator.
10 Machine Condition — Telling a Good Machine from a Bad One
A load test is a diagnostic. If every machine is healthy, all three procedures agree and there is nothing to learn from running more than one. The Condition control puts the same nameplate machine on the bench in six different states, and each fault leaves a different fingerprint across the tests:
| Condition | What is physically wrong | Which test finds it | Why |
|---|---|---|---|
| Healthy | To nameplate | — | The reference every other condition is judged against. |
| Damaged armature winding | Ra up 2.5× from a poor joint or damaged coil | Brake test only | Speed regulation worsens from 3.40 to 8.96%, but no-load current, constant losses and coast-down are all normal — Ra costs nothing until current flows. Swinburne's test misses this fault completely. |
| Worn brushes | Contact drop more than doubled | Swinburne vs brake only | Everything looks near-normal except Swinburne's error, which triples to +1.55 points. Brush loss grows with current while the method pins it at its negligible no-load value. |
| Dry / failing bearings | Friction and windage up 3× | All three | No-load current 3.13 → 4.50 A, constant losses 689 → 989 W, coast-down 24.2 → 15.2 s. |
| Shorted laminations | Core loss up 3× from broken inter-lamination insulation | Retardation, to separate it | Looks almost identical to a bearing fault on the brake and Swinburne tests. The coast-down at reduced excitation separates them: core loss follows the flux, friction does not. |
| Differential compounding (not a fault, a connection) | Series field wired to oppose the shunt | Brake test, by its sign | Speed rises with load. Push far enough and the series MMF cancels the shunt field entirely: torque peaks at about 8× rated and then collapses, and the rig reports FIELD COLLAPSED rather than a plain stall. Weaken the shunt field first and it happens far sooner. This is why differential compounding is a cautionary tale rather than a design choice. |
| Shorted field turns | Flux down to 82%, field resistance down | Retardation, by its direction | The coast-down gets longer (24.2 → 31.6 s) — the only fault that does, because weak flux means less core loss to coast against. The machine also runs fast and draws more current for the same torque. |
After each run the tool measures the same machine at its healthy nameplate and prints both columns side by side, flags every quantity that is out, and then names the fault from the pattern — because no single test can. That verdict also appears as section 5 of the PDF report, so a lab record shows the reasoning and not just the numbers.
One more thing the presets show without any fault at all: field weakening costs efficiency. Ward-Leonard and Field Weakening are the same machine — only the field supply differs. At its base speed it returns 83.5%; at twice base speed on half the flux it returns 76.8%, because friction and windage climb roughly as N² and the rotational loss grows from 6.7% of output to 22%. That is why practical drives limit field weakening to about two to three times base speed rather than pushing further.
Two machines make the point on their own without any fault at all: Compound Press (cumulative) droops under load like any normal motor, while Differential Compound speeds up as you load it — 938 rev/min at no load rising to 1022 at 25% overload — because its series field opposes the shunt and the flux falls away. That is why differential compounding is a textbook cautionary tale rather than a design choice.
11 Reference Tables & How the Numbers Are Checked
The article below this guide carries four reference tables you can use directly for coursework:
- Ke vs Kt — the two machine constants, their definitions (PZ/60A and PZ/2πA), units, and the 9.5493 ratio between them.
- Equivalent circuit elements — what each element represents and the loss it produces.
- The three characteristic curves — T–Ia, N–Ia and N–T, compared across shunt, series and compound.
- Nine worked nameplates — V, Ra, φ, rated speed, armature current, output and efficiency for every preset in the tool.
Those figures are not typed in by hand. A verification harness re-derives them from the same engine the simulator runs and asserts them alongside the physics — over 445,000 checks across 75,000+ operating states, covering the EbIa = Tω identity, the complete power balance, every preset's rated speed, and the article's own worked figures. If the model and the article ever disagreed, the harness would fail rather than let the page publish a wrong number.
Understanding DC Motors — Free Interactive Simulator
A DC motor converts direct-current electrical energy into mechanical rotational energy. The Lorentz force on a current-carrying conductor in a magnetic field creates a torque on the rotor. This simulator lets you explore back EMF, armature current, speed-torque characteristics, the complete loss ledger, and efficiency across four configurations — shunt, series, separately excited, and compound — with live unit conversion, step-by-step calculation, nameplate-accurate presets, and CSV/PNG export.
Ke and Kt: why a DC motor has two machine constants
Textbooks write both Eb = KφN and T = KφIa, and the same symbol in both places causes more errors than any other point in DC machine theory. The two constants are not the same number:
| Constant | Definition | Used in | Units |
|---|---|---|---|
| Ke (speed constant) | PZ / (60A) | Eb = KeφN, with N in rev/min | V per (Wb · rev/min) |
| Kt (torque constant) | PZ / (2πA) | T = KtφIa, with T in N·m | N·m per (Wb · A) |
| Ratio | Kt / Ke = 60 / 2π | — | 9.5493 |
P is the number of poles, Z the total armature conductors and A the number of parallel paths. The factor of 9.5493 is nothing more than the rev/min-to-rad/s conversion, but it is not optional: substitute one constant for the other and the identity EbIa = Tω — the statement that electrical power converted equals mechanical power developed — fails by that same factor, and every efficiency figure comes out roughly nine times too small. In SI (T in N·m, ω in rad/s) the two constants are numerically equal, which is why the distinction only bites when speed is quoted in rev/min. This simulator carries both constants separately and shows them side by side in the Show Calculations panel.
How is back EMF calculated in a DC motor?
Back EMF is the voltage generated by the rotating armature that opposes the supply voltage: Eb = V − IaRa − Vbrush, where Vbrush is the contact drop across the brush pair (about 2 V for carbon brushes, and often ignored in first-year treatments). Motor speed is directly proportional to back EMF and inversely proportional to field flux: N = Eb / (Ke·φ). At standstill Eb = 0, so starting current Istart = V / Ra is very large — that is why large motors require a starter resistor or soft-start drive.
What is the equivalent circuit of a DC motor?
The DC motor equivalent circuit is a voltage source (the back EMF Eb) in series with the armature resistance Ra and the brush contact drop. Everything the machine does electrically follows from that one loop:
| Element | Represents | Equation |
|---|---|---|
| Eb (source) | Rotation generating EMF against the supply | Eb = KeφN |
| Ra (series R) | Armature winding, interpoles, compensating winding | Pcu = Ia2Ra |
| Rse (series R) | Series field winding — series and compound machines only | Pse = Ia2Rse |
| Vbrush (fixed drop) | Carbon brush contact, roughly 2 V per pair, near-constant with current | Pbrush = VbIa |
| Rsh (parallel branch) | Shunt field across the supply — shunt and compound machines | Ish = V/Rsh |
The DC shunt motor equivalent circuit adds the field branch in parallel, so the line current splits: IL = Ia + Ish. In a series machine there is no parallel branch at all — one current flows through field and armature alike, which is exactly why flux tracks load. The simulator draws this circuit live in Explore mode and reports Ia, Ish and IL as separate readouts, so you can watch the split change as you move the supply voltage.
Shunt vs. Series vs. Separately Excited — quick comparison
| Parameter | Shunt | Series | Separately Excited | Compound (cumulative) |
|---|---|---|---|---|
| Field connection | Parallel with armature | Series with armature | Independent supply | Both windings on the same poles |
| Flux φ | Nearly constant | Increases with Ia | Set by Vfield | φsh + φse(Ia) |
| Speed-torque curve | Almost flat | Hyperbolic, steep | Linear (adjustable) | Drooping, between the two |
| Starting torque | Moderate | Very high (T ∝ Ia2) | Adjustable | High |
| No-load behaviour | Stable, near rated speed | Runs away — do not uncouple | Stable | Stable (shunt field sets the ceiling) |
| Typical application | Lathes, blowers, conveyors | Cranes, hoists, traction | Ward-Leonard, modern drives | Presses, shears, rolling mills |
What is the speed-torque characteristic of a DC motor?
The speed-torque curve is the most important performance characteristic. For shunt and separately-excited motors it is very nearly linear: N = V/(Keφ) − T·Ra/(Keφ)(Ktφ). For series motors it is hyperbolic, with very high speed at light load. The operating point is where this curve intersects the load torque line. Our simulator samples the curve from the same solver that drives the readouts — 240 points, losses included — so the drawn curve and the reported numbers cannot disagree, and it marks the operating point with a coloured dot projected to both axes.
Two consequences follow from that slope expression, and they are worth checking on the Explore tab. Under armature-voltage control the flux is fixed, so the slope −Ra/(Keφ)(Ktφ) does not change: the family of curves is a set of parallel lines, each with a lower no-load speed and a proportionally lower stall torque. Under field control the no-load speed rises as 1/φ while the stall torque falls with φ, so that family fans out. Neither family passes through a common stall point, and a diagram drawing them to one is a common textbook error.
Characteristics of a DC motor — the three curves you are asked to draw
Exam questions on DC motor characteristics almost always mean one of three plots, all of which fall out of Eb = KeφN and T = KtφIa:
| Characteristic | Shunt / separately excited | Series | Cumulative compound |
|---|---|---|---|
| Torque vs armature current (T–Ia) | Straight line through the origin — φ is constant, so T ∝ Ia | Parabola — φ ∝ Ia, so T ∝ Ia2, straightening to a line once the iron saturates | Between the two — linear shunt term plus a parabolic series term |
| Speed vs armature current (N–Ia) | Very slightly drooping straight line — only the IaRa drop reduces N | Rectangular hyperbola — N ∝ 1/Ia, rising without practical bound as Ia → 0 | Drooping, steeper than shunt, but bounded at no load by the shunt field |
| Speed vs torque (N–T) | Nearly flat; slope −Ra/(Keφ)(Ktφ) | Steeply hyperbolic | Drooping, sits between shunt and series |
The speed vs armature current graph of a DC series motor is the one students most often draw wrongly. It is a hyperbola, not a straight line, and it does not actually reach infinity: friction, windage and core loss still demand torque at any speed, so the current cannot fall to zero. Load the Crane Hoist preset and drag the load toward zero — the simulator settles at about 2,600 rev/min against a 700 rev/min nameplate, roughly 3.7× rated, because windage rises as N² and eventually balances the machine. That is the honest answer to "how fast does a series motor actually run away?"
How do you control the speed of a DC motor?
Three speed-control methods are demonstrated in Explore mode:
- Armature voltage control — vary V to scale speed below the base value. Most efficient method, common in modern thyristor drives.
- Field weakening — reduce φ to push speed above the base value. Used for constant-power operation above rated speed.
- Armature resistance control — add series resistance. Simple but lossy — the inserted resistance dissipates power continuously.
Why does a DC series motor have such high starting torque?
In a series motor the same current flows through both the field and the armature. Flux φ is approximately proportional to Ia (below saturation), so torque T = KφIa becomes T = K·k·Ia2. At startup Eb = 0 and Ia is very large, so torque is enormous — ideal for cranes, hoists, electric traction (locomotives), and starter motors.
A 5 kW Motor at Rated Load — The Numbers Behind the Curve
Take a typical industrial shunt-wound DC motor: 230 V, 5 kW rated mechanical output, 1500 rpm rated speed, armature resistance Ra = 0.3 Ω, field resistance Rf = 115 Ω, mechanical losses 250 W. The simulator’s 220 V Lathe preset is the same class of machine (5 kW, 220 V, Ra = 0.30 Ω, Rf = 115 Ω, 1500 rev/min) and lands at about 85 % efficiency, so you can load it and compare each line below against the Power flow panel:
| Quantity | Working | Result |
|---|---|---|
| Rated torque | T = 60P/(2πN) = 60×5000/(2π×1500) | 31.8 N·m |
| Field current | If = V/Rf = 230/115 | 2.0 A |
| Mechanical + iron losses | given | 250 W |
| Armature input power (estimate) | Parm = Pmech + losses | ~5250 W |
| Armature current (back-EMF method) | Ia ≈ 24 A (from iterative solution) | 24 A |
| Copper losses in armature | Ia²Ra = 24²×0.3 | 173 W |
| Copper losses in field | If²Rf = 4×115 | 460 W |
| Overall efficiency | η = 5000/(5000+250+173+460) | 85 % |
| Back EMF | Eb = V − IaRa = 230 − 24×0.3 | 222.8 V |
Eighty-five percent efficiency for a 5 kW DC motor is roughly correct; large industrial shunt motors at 100 kW reach 92−94 %. The losses scale unfavourably toward smaller motors because the field power stays roughly constant while the output drops. You can watch that directly: the 12 V Hobby preset settles near 72 %, the 5 kW lathe near 85 %, the 15 kW mill near 89 %, and the 53 kW traction motor near 94 %.
Which DC machine lab experiments can you run here?
The simulator is a DC machines virtual lab: the brake-drum rig runs four of the standard undergraduate experiments end to end, automatically, and issues a printable test report for each. Press Load Test to choose one.
| Experiment | Method | Measures | Classic limitation |
|---|---|---|---|
| Brake test on a DC motor (direct loading) | Mechanically load the shaft and measure the torque directly from the brake | Torque, output power, measured efficiency, speed regulation | Wastes the whole output as heat — impractical above a few kilowatts |
| Swinburne's test (no-load, indirect) | Measure the no-load input, separate the constant losses, predetermine efficiency arithmetically | Constant losses Wc, predetermined η at any load | Assumes constant losses stay constant, so it reads optimistic; cannot be used on a series motor |
| Speed control test | Re-connect the field to its own supply, then vary armature voltage below base speed and weaken the field above it | N vs V, N vs φ, base speed, speed range | Needs independent excitation — on a plain shunt machine the field falls with the supply, so speed hardly moves; field weakening also sheds torque as fast as it adds speed |
| Retardation test (running-down) | Open the supply and time the coast-down against the machine's own friction, windage and iron loss | dN/dt, moment of inertia J, rotational loss | Needs J, or a second run with a known added loss, to separate the two unknowns |
Two more experiments belong to this family but need a second identical machine, which a single-machine rig cannot honestly represent: Hopkinson's test (back-to-back, where two coupled machines circulate power and the supply provides only the losses, allowing a full-load heat run on a small supply) and Field's test (the series-motor equivalent of Swinburne's). They are not offered here rather than faked.
How do you perform a brake test on a DC motor?
A brake test is the direct method: you load the shaft mechanically and measure the torque, so the efficiency you get is measured rather than inferred. On this rig a belt runs from the motor pulley to a brake drum, and a band around the drum is anchored through two spring balances reading T1 and T2. The procedure is:
- Run the machine light and record the no-load speed and current.
- Tighten the brake in steps — here 25, 50, 75, 100 and 125% of rated load — letting speed and current settle at each.
- At every step read V, line current IL, field current Ish, speed N and both balances.
- Compute shaft torque T = (T1 − T2) × R, output Pout = Tω, input Pin = V IL and η = Pout/Pin.
- Plot N, T, η and IL against output power — the performance curves.
Speed regulation follows from the same table: (Nno-load − Nfull-load) / Nfull-load. Efficiency peaks somewhat below rated load, where the variable copper loss has grown to equal the constant field, iron and windage losses — you can watch that crossover happen in the plotted curve.
What is Swinburne's test, and why does it over-state efficiency?
Swinburne's test determines efficiency without loading the machine. Run it light at rated voltage and measure the no-load input W0 = V IL0. Subtract the armature copper loss at no load, Ia02Ra, and what remains is the constant losses Wc — field, iron, friction and windage. Efficiency at any load then follows arithmetically, because only the copper loss changes with current:
η = (V IL − Ia2Ra − Wc) / (V IL)
It is cheap, quick and safe, which is why it is the standard workshop check. But the assumption in its name — that the constant losses really are constant — is not quite true: iron loss rises with load as armature reaction distorts the field, brush loss grows with current, and stray load loss is ignored altogether. So Swinburne's test reads optimistic. Run both tests here on the same machine and the tool tabulates the gap for you; on the 220 V lathe preset it comes to roughly half a percentage point at every load, always in the same direction. That is exactly why acceptance testing uses a direct or back-to-back method instead.
There is a subtlety worth knowing, and this simulator will show it to you. The textbook claim — that Swinburne's test always reads optimistic — assumes the machine's speed barely changes between no load and full load. Two unmodelled effects actually compete. Brush and stray losses grow with current, which the method ignores, so it under-charges losses and reads high. But rotational loss falls as the machine droops under load, and the method holds that fixed at its no-load value, so it over-charges and reads low. On a normally excited machine the first wins and the error is positive. On a deeply field-weakened machine, running fast with a large rotational loss, the second can win and the error changes sign — run the Field Weakening preset and compare. On a compound machine there is a third term: the series field carries the armature current, so it belongs in the armature-circuit resistance, not in the constant losses.
It also cannot be applied to a series motor at all: flux is proportional to armature current, so at no load the flux collapses and the machine races rather than settling at a steady light-running speed. The picker blocks it and says why.
How do you diagnose a faulty DC motor from its test results?
This is what a load test is actually for, and it is the part most simulators leave out. A single test rarely names a fault; the pattern across several tests does. Put the same machine on the bench in one of six conditions — healthy, worn brushes, dry bearings, shorted laminations, a damaged armature winding, or shorted field turns — and each leaves its own fingerprint:
| What the tests show | Brake | Swinburne | Retardation | Diagnosis |
|---|---|---|---|---|
| Regulation 8.96% against 3.40% healthy; everything else normal | out | ok | ok | Damaged armature winding. Ra costs nothing until current flows, so the fault is invisible at no load — Swinburne's test misses it completely. |
| Swinburne's error triples, +0.55 → +1.55 points | ok | out | ok | Worn brushes. Brush loss grows with current while the method pins it at its negligible no-load value, so only the gap between the two methods reveals it. |
| No-load current 3.13 → 4.50 A, Wc 689 → 989 W, run-down 24.2 → 15.2 s | out | out | out | Dry or failing bearings. Rotational loss is up, and the reduced-excitation run-down shows the flux-independent part has grown — so it is mechanical. |
| The same picture, but the run-down falls further, to 10.5 s | out | out | out | Shorted laminations. Core loss follows the flux and friction does not; repeating the coast-down at reduced excitation is what separates the two. |
| Run-down gets longer, 24.2 → 31.6 s, and the machine runs fast | ok | out | out | Shorted field turns. The only fault that lengthens a coast-down, because weak flux means less core loss to coast against. |
After every run the tool re-measures the same machine at its healthy nameplate, prints both columns side by side, flags each quantity that is out of tolerance and states the conclusion in words. That verdict is section 5 of the exported PDF test report, so a lab record carries the reasoning and not just a table of numbers. It asks you to think like a maintenance engineer rather than a calculator — which is the point of running three different tests on one machine.
What are the losses in a DC motor, and how is efficiency calculated?
A DC motor efficiency calculation is a bookkeeping exercise: every watt drawn from the supply either leaves through the shaft or is lost. The simulator models all five loss terms and shows them itemised in the Power flow panel, in watts and as a percentage of input:
| Loss | Expression | Varies with | Typical share at rated load |
|---|---|---|---|
| Armature copper | Ia2Ra | Load squared | 4–10 % |
| Series field copper | Ia2Rse | Load squared (series & compound only) | 2–6 % |
| Brush contact | VbIa (Vb ≈ 2 V) | Load, roughly linearly | 0.5–2 % |
| Field excitation | V·Ish or VfIf | Essentially constant | 1–5 % |
| Iron + friction + windage | core ∝ φ1.6N1.5; f + w ∝ N2 | Speed, not load | 1–4 % |
So η = Pout / Pin where Pin = V·IL and Pout = Tshaftω. The split into variable losses (copper, which scale with load squared) and constant losses (field, iron, windage) explains the shape of the efficiency curve: peak efficiency occurs at the load where the two are equal, which is usually somewhat below rated. Drag the load slider from zero upward and watch the efficiency readout rise, peak, and fall.
Click Show Calculations for the full derivation of the current operating point in eight steps, ending with the power balance and the EbIa = Tω cross-check. That is what makes this a working DC motor calculator rather than an animation: the numbers are solved, shown, and independently verified.
DC motor nameplate reference — ten worked machines
Every preset in the simulator is a complete machine, not a slider position. Each carries its own speed constant Ke, shunt-field resistance, brush drop and rotational-loss coefficients, solved so the preset reproduces its rated speed. Use these as sanity-check figures for coursework:
| Preset | Type | V | Ra (Ω) | φ (mWb) | Rated speed | Ia | Pout | η |
|---|---|---|---|---|---|---|---|---|
| 12 V Hobby | Shunt | 12 | 0.25 | 1.5 | 3000 rev/min | 3.1 A | 31.4 W | 72.0 % |
| 220 V Lathe | Shunt | 220 | 0.30 | 20 | 1500 rev/min | 25.1 A | 5.03 kW | 84.7 % |
| 440 V Mill | Shunt | 440 | 0.65 | 32 | 1500 rev/min | 37.7 A | 14.9 kW | 85.1 % |
| Crane Hoist | Series | 220 | 0.25 | 22.2 at load | 700 rev/min | 53.6 A | 10.3 kW | 87.1 % |
| EV Traction | Series | 600 | 0.22 | 27.2 at load | 1200 rev/min | 96.4 A | 52.8 kW | 91.2 % |
| Auto Starter | Series | 12 | 0.008 | 1.4 at load | 1200 rev/min | 75.6 A | 754 W | 83.1 % |
| Ward-Leonard | Sep. excited | 240 | 0.35 | 22 | 1200 rev/min | 26.4 A | 5.66 kW | 83.5 % |
| Field Weakening | Sep. excited | 240 | 0.35 | 11 (Vf halved) | 2408 rev/min | 24.2 A | 4.54 kW | 76.8 % |
| Compound Press | Cumulative | 240 | 0.28 | 27.1 total | 1000 rev/min | 29.4 A | 6.28 kW | 83.3 % |
| Differential Compound | Differential | 240 | 0.28 | 21.6 total | 1000 rev/min | 22.0 A | 4.71 kW | 81.9 % |
The efficiency trend across that table is the real lesson: 72 % at 31 W, 85 % at 5 kW, 85 % at 15 kW, 91 % at 53 kW. Field and iron losses stay roughly fixed while output grows, so small machines are inherently worse. Every figure here is regenerated and checked by the tool's verification harness, so the table and the simulator cannot drift apart.
Why Series Motors Run Away on No Load
The series-motor speed equation is N ∝ Eb/φ. Since φ ∝ Ia for a series motor, and at no load Ia drops nearly to zero, the flux collapses and the speed shoots up. It does not literally go to infinity: friction, windage and core loss still demand torque, and the current cannot fall below the value that supplies it. In the simulator the Crane Hoist preset settles at roughly 2600 rev/min against a 700 rev/min nameplate — about 3.7× rated — which is a realistic figure and already well past the mechanical limits of a commutator and banding. Bigger machines with lower windage go further, and that is where armatures fail.
This is exactly why electric trains, hoists, and cranes use series motors only when permanently connected to a load (the wheels, the hook, the rope drum). Modern variable-speed drives sidestep this by using induction or permanent-magnet motors with electronic field control, where the field cannot collapse.
Brushed vs Brushless — What Changed in the Last Twenty Years
Traditional DC motors use mechanical brushes and a commutator to switch armature current direction as the rotor turns. This works but brings two problems: brushes wear (typical life 2000−5000 hours of continuous duty), and commutation produces electrical noise plus mechanical vibration. Brushless DC motors (BLDC) move the windings to the stator and use permanent magnets on the rotor, with solid-state switching (the inverter) replacing the commutator. Result: longer life (limited only by the bearings), higher efficiency (94−98 % at the design point), and quieter operation.
The cost is the inverter. A brushed motor needs a DC supply and a brush set. A BLDC needs a microcontroller, three half-bridge MOSFET switches, and a rotor-position sensor. Twenty years ago the inverter cost more than the motor. Today, with off-the-shelf BLDC controllers at a few dollars, brushed motors are mostly relegated to low-cost toys, cheap power tools, and educational demonstrations.
Where this simulator's model stops
Being explicit about the limits is part of getting the physics right. The model assumes a magnetically linear shunt field (flux proportional to field current, no open-circuit-characteristic knee), applies saturation only to the series/compound field through a single hyperbolic term, and ignores armature reaction, commutation delay, brush-shift effects, and all thermal variation of resistance. Rotational loss is a two-term engineering fit — friction and windage as N², core loss as φ1.6N1.5 — referred to each machine's nameplate point, not a measured retardation test. Everything is steady state: there is no inertia, so no run-up transient and no dynamic braking. Within those bounds, the model conserves power exactly, and that is verified rather than asserted — deploy/verify-dc-motor-physics.js checks EbIa = Tω and the full loss ledger across the whole reachable state space.
References for DC Motor Analysis
- Chapman, S. J. — Electric Machinery Fundamentals, 5th ed., Chapter 8 (DC Motors and Generators).
- Sen, P. C. — Principles of Electric Machines and Power Electronics, 3rd ed.
- IEEE Std 113-1985 — Test Procedures for Direct-Current Machines.
- NEMA MG 1 — Motors and Generators. The North American standard for motor ratings.
Explore Related Simulators
If you found this DC Motor simulator helpful, explore our AC Generator simulator, Induction Motor simulator, Faraday's Law simulator, Transformer simulator, Kirchhoff Solver, RLC Circuit simulator, the House Wiring Simulator, and the Magnetic Playground (the motor effect, F = BIL and Fleming’s left-hand rule) for more hands-on electrical engineering practice.
Updated