

Mathematics & Graphing Tools
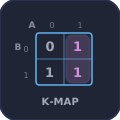
Math simulations that draw the idea as they compute it: a function and its slope, an integral filling in, matrices multiplying row by column, a Boolean expression simplifying on a Karnaugh map.
- 6 tools
- 3 topics
Functions & Calculus
Plot a function and see its slope and area: the graph behind every derivative and integral.
Algebra & Geometry
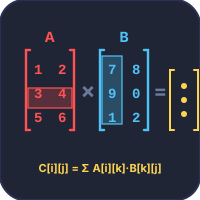
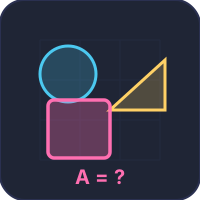
Matrices and the areas of shapes, each worked step by step.
Boolean Algebra & Logic
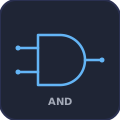
The algebra of true and false, and the circuits built from it.
Seeing the Mathematics
A formula states a relationship; a picture shows it. A derivative is easier to understand as the slope of a tangent sliding along a curve, and an integral as the area of rectangles that get thinner until they fit the curve exactly. Matrix multiplication makes sense once each row is seen meeting each column, and simplifying a Boolean expression becomes a matter of circling neighbouring cells on a Karnaugh map. Each tool here draws the idea as it computes the answer, so the picture and the working stay together.
Where This Mathematics Appears in Engineering
Every topic on this page is used somewhere else on the site. Following one of those links is a quick answer to the question every student eventually asks: what is this for?
| Mathematics | Engineering use | See it in |
|---|---|---|
| Functions and graphs | Reading a machine’s response curve | Pump curves, stress-strain curve |
| Derivative | Velocity and acceleration from position | Slider-crank, projectiles |
| Integral | Work and energy as the area under a curve | Engine P-V diagram, toughness |
| Matrices and linear systems | Solving simultaneous equations | Circuit analysis, truss forces, support reactions |
| Areas and centroids | Section properties of beams | Moment of inertia |
| Boolean algebra | Digital logic and machine control | PLC ladder logic |
For Students and Teachers
The tools cover secondary-school mathematics through the first years of an engineering degree. They run in any browser, including on a projector or a phone, with no sign-up, so a teacher can demonstrate an idea live and students can repeat it at home. Graphs can be annotated and exported for notes and worksheets.
Frequently Asked Questions
Are these maths tools free?
Yes. All of them are free, run in the browser and need no account or download.
What level of mathematics do they cover?
From secondary-school areas, graphs and functions to first-year university calculus, matrices and Boolean algebra.
Why are logic gates in a mathematics collection?
Logic gates are Boolean algebra made physical. Simplifying a logic circuit is the same problem as simplifying a Boolean expression, which is what a Karnaugh map does, so the two are taught together in discrete mathematics and in digital electronics.
Can I save or export the graphs?
Yes. The graphing tool lets you annotate a plot and export it as a PNG image for notes, worksheets or reports.
Explore Related Simulators
Updated